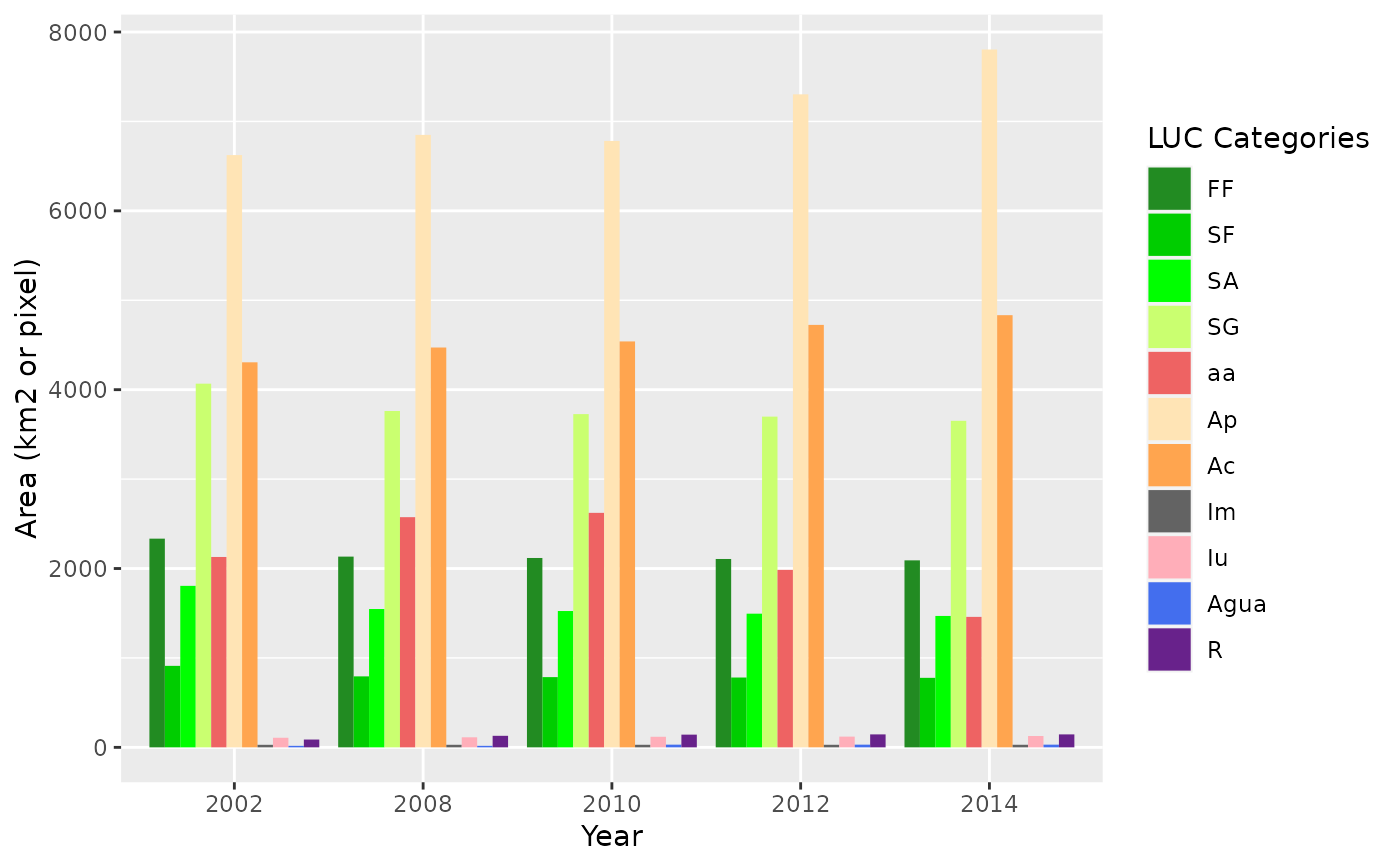
A grouped barplot representing the areas of LUC categories at each time point of the analysed period.
Usage
barplotLand(
  dataset,
  legendtable,
  title = NULL,
  caption = "LUC Categories",
  xlab = "Year",
  ylab = "Area (km2 or pixel)",
  area_km2 = TRUE,
  ...
)
Arguments
- dataset
A table of the multi step transitions (
lulc_Multistep) generated bycontingencyTable.- legendtable
A table containing the LUC legend items and their respective color (
tb_legend).- title
character. The title of the plot.
- caption
character. The caption of the plot.
- xlab
character. Label for the x axis.
- ylab
character. Label for the y axis.
- area_km2
logical. If TRUE the change is computed in km2, if FALSE in pixel counts.
- ...
additional themes parameters, see
theme.
See also
ggplot2::theme
Examples
# editing the category names

SL_2002_2014$tb_legend$categoryName <- factor(
  c(
    "Ap", "FF", "SA", "SG", "aa", "SF",
    "Agua", "Iu", "Ac", "R", "Im"
  ),
  levels = c(
    "FF", "SF", "SA", "SG", "aa", "Ap",
    "Ac", "Im", "Iu", "Agua", "R"
  )
)

SL_2002_2014$tb_legend$color <- c(
  "#FFE4B5", "#228B22", "#00FF00", "#CAFF70",
  "#EE6363", "#00CD00", "#436EEE", "#FFAEB9",
  "#FFA54F", "#68228B", "#636363"
)
# the plot
barplotLand(
  dataset = SL_2002_2014$lulc_Multistep,
  legendtable = SL_2002_2014$tb_legend,
  area_km2 = TRUE
)