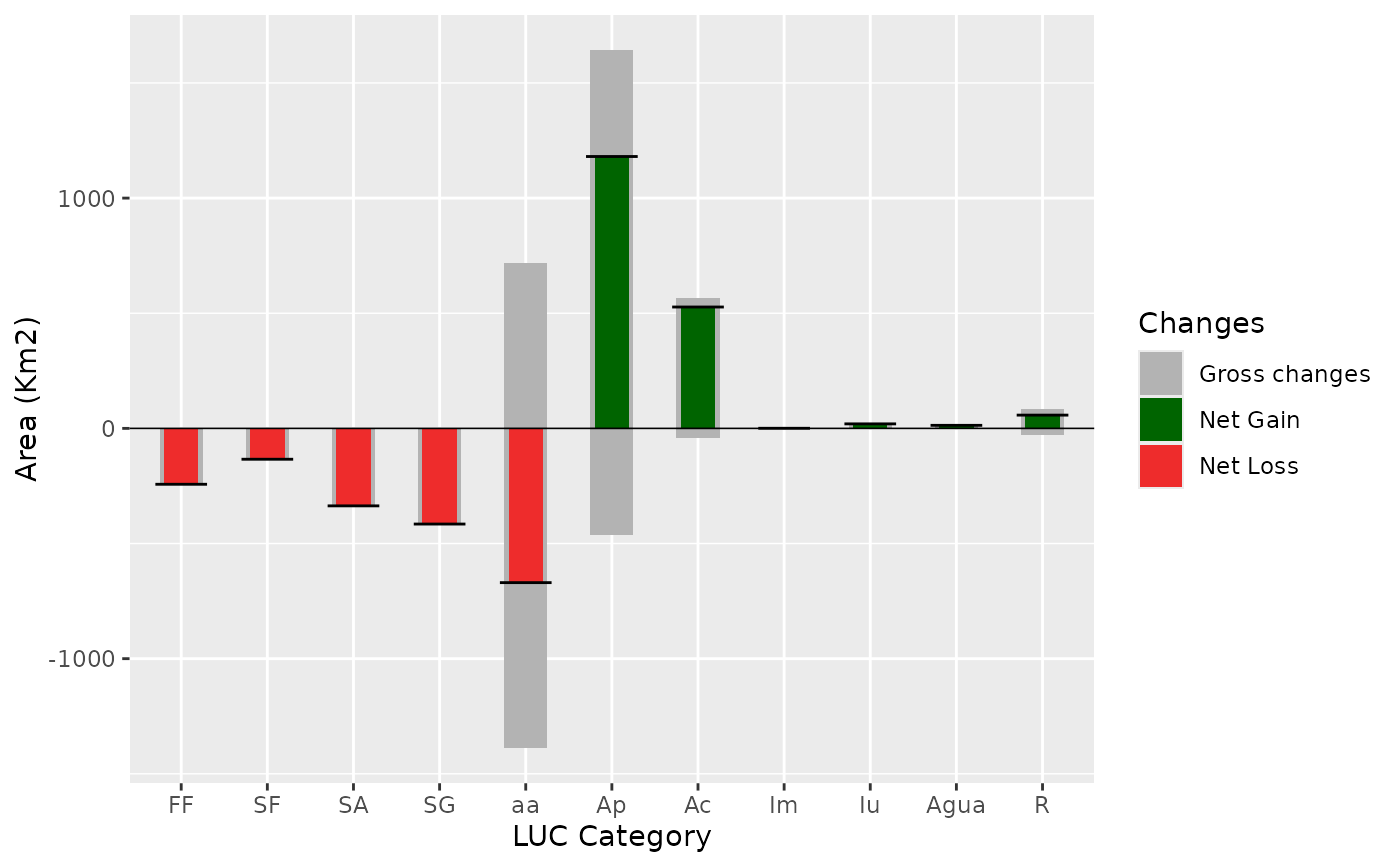
A stacked barplot showing net and gross changes of LUC categories during the entire analysed time period.
Arguments
- dataset
A table of the multi step transition (
lulc_Mulstistep) generated bycontingencyTable.- legendtable
A table containing the LUC legend items and their respective color (
tb_legend).- title
character. The title of the plot (optional), use
NULLfor no title.- xlab
character. Label for the x axis.
- ylab
character. Label for the y axis.
- legend_title
character. The title of the legend.
- changesLabel
character. Labels for the three types of changes, defaults are c(GC = "Gross change", NG = "Net gain", NL = "Net loss").
- color
character. A vector defining the three bar colors.
- area_km2
logical. If TRUE the change is computed in km2, if FALSE in pixel counts.
Examples
# editing the category names

SL_2002_2014$tb_legend$categoryName <- factor(
  c(
    "Ap", "FF", "SA", "SG", "aa", "SF",
    "Agua", "Iu", "Ac", "R", "Im"
  ),
  levels = c(
    "FF", "SF", "SA", "SG", "aa", "Ap",
    "Ac", "Im", "Iu", "Agua", "R"
  )
)

# the plot
netgrossplot(
  dataset = SL_2002_2014$lulc_Multistep,
  legendtable = SL_2002_2014$tb_legend,
  title = NULL,
  xlab = "LUC Category",
  changes = c(GC = "Gross changes", NG = "Net Gain", NL = "Net Loss"),
  color = c(GC = "gray70", NG = "#006400", NL = "#EE2C2C")
)